A Tool for Covered Call Selection
I may not have traded the RUT last week but I did spend time working on the “One Spreadsheet”, aka “The Spreadsheet to rule them all”.
I have disclosed from the beginning of this blog endeavor and I have known since the beginning of my 18 month plan – a beginning that began years before I began it – that my plan works. I know this because of the profits I have produced year after year and I have even seen consistency improve in the months since I formally launched this blog and this plan.
However, I have known in parallel that while it works, I cannot always get to the root of why.
“A systematic approach to training is one of the key factors in becoming a successful athlete. It is not enough to know how to do something, you must know why you are doing it”.
Greg LeMond, the only American to win the Tour de France
Why does it work, why do I select my stocks and options, why do I select certain expiration dates. Why do certain stocks and options create so much stress and anxiety for me.
Conversely, how do I codify a system that produces those results so I can explain it to someone else? I have always believed that in order to truly understand something complicated, you have to be able to explain it to a 6th grader.
In this case, I also believe that if I fully understood the how AND the why, it would not produce these levels of stress and anxiety.
So I asked myself these questions:
- What is my goal? ($10,000 net per month, net being after taxes and after $5,000 per month remains in the account to keep it growing. This really means $25,000 per month gross).
- Why is this important? (The numbers are the numbers. Every person has their own set of numbers. For me it boils down to this : the ability to not think about money – that is wealth. $10,000 net gives me that freedom.)
- What tools do I need to get there? (This is the first area in which the spreadsheet comes in. I have been producing $500-1500 per week with a capital nest egg that began at $60,000. 10 weeks into this, I am realizing how challenging these consistent returns are. If I really expect to hit $25,000 per month, I need to calculate the capital requirement. It’s certainly more than $70,000 or $10,000 or even $250,000. One of the key levers in the spreadsheet is the ability to toggle forecasted returns based on different capital stacks).
- What produces stress and anxiety? (This is the key to the spreadsheet. The need to hit 1-3% per week is stressful, because it is so difficult that it is almost impossible. There are various tiers of stocks/options and I am began by bucketing them into 3 tiers, which I will explain below. The more of a capital stack I can acquire and then the lower volatility stocks I can play with, that is what leads to lower and then no anxiety, as will be spelled out here).
To answer to all of these questions, I needed to build a tool capable of (1) forecasting the income from my covered calls and (2) applying weights to various risk tolerances.

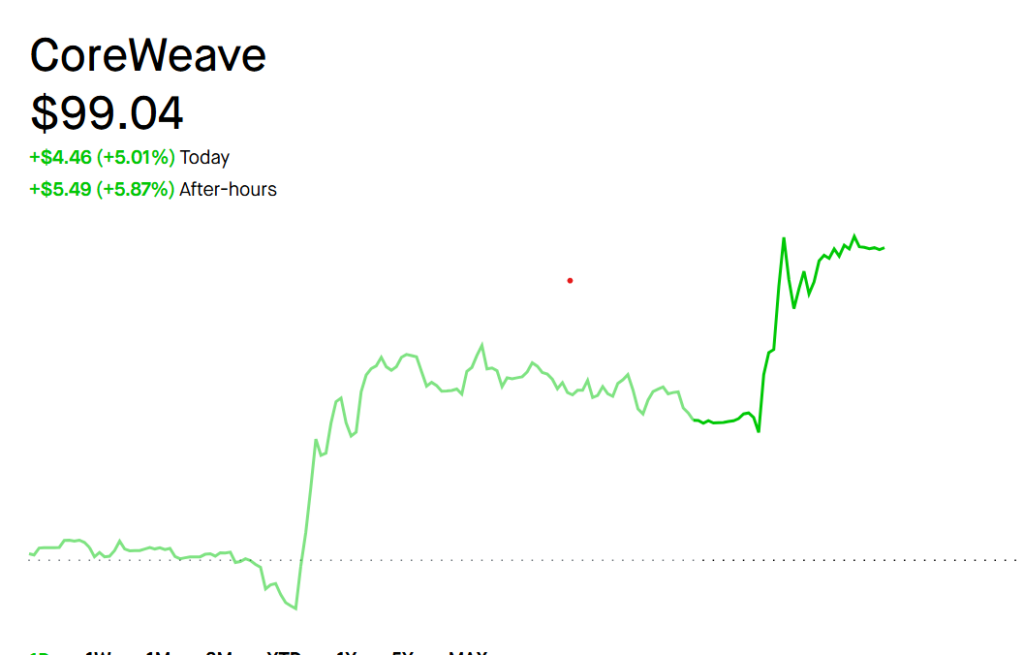
In English, yeah I am making $1,000s each week from my CRWV holdings but it’s stressful and holdings like that have the potential to swing wildly every week, forever really. Same goes for TSLA, GME, OPEN, META, IONQ and dozens more.
Any one can bet on red and win for awhile. But man it’s exhausting and severely unsustainable.
I got into this plan to some extent to lower my stress level and create a plan that generates reliable weekly income so someday I won’t need a W2.
There’s a bit on 30 Rock where Jack brings the group together and they decide to reimagine the microwave. They wanted to throw out all the rules, they wanted to start from scratch and they iterated for days on it.
In the end, they realized they took the simple thing they were trying to make simpler, they iterated for 50 hours straight and in the end they took that simple thing and make it incredibly complicated.
They took a microwave and turned it into the Pontiac Aztek.

I realized this week working on the “One Spreadsheet” that I took a microwave and created the Pontiac Aztek.
The wild swings of a CRWV or the daily stress of the RUT basically create more stress for me than the daily work stress I am trying to replace.
So, there’s a starting point. Let’s fix that.
How it Works
The One Spreadsheet has 4 main levers – (1) Weekly Income Goal, (2) Working Capital, (3) Weekly Yield by Tier, (4) Weighted Average of Tiers.
1. Weekly Income Goal
My weekly goal is $6,250 gross ($25,000 per month) for all of the reasons stated above. The Spreadsheet begins with this number and then works backward with the variables below in order to achieve it.
Everyone will have a different weekly income goal.
2. Working Capital
Next, working capital. How much money do I have to trade with each week. Generating $700-2000 per week with $70,000 is a tall task. Generating $6,250 per week with $1,000,000 much less so.
By the nature of options premiums and volatility, this unfortunately means I need to spend more time with the highly volatile, aggressive approach of the CRWV’s & IONQ’s until I have a bigger capital stack to work with.
The long-term objective here is to set it and forget it. I am not looking to leave a company where I am stressed about the financials that I do control only to be stressed out every day by the stock financials of companies I don’t control.
To get there will require a lot more than the $75,000 I am working with right now. I can squeeze $1,000 or so out each week of $75,000 but it requires more time and anxiety than I like. The longer I go in this 18 month plan the more I see that the number is closer to $500,000-$1,000,000 to reach a place of set it and forget it.
You can’t get to $1,000,000, though, until you first get to $750,000, $500,000, $250,000 and $100,000. That’s just good math.
So you begin the One Spreadsheet by entering starting capital. How much available capital do you have to work with? Remember that number can never be less than $25,000 due to the rules of option trading and specifically Pattern Day Trader rules.
The starting capital number will have a downstream effect on the weekly yield you need to achieve; the lower the starting capital, the higher the yield you will need. By extension, the higher the necessary yield, the higher the risk you need to take each week in order to hit it.
3. Weekly Yield
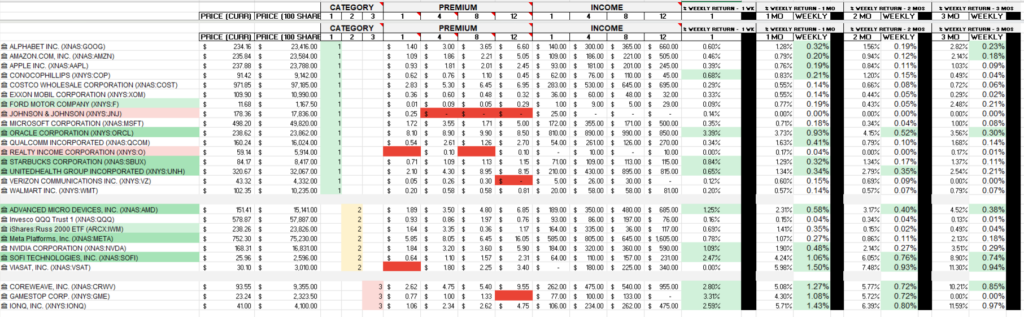
Next, weekly yield. I spent my 8 hours of flight time from Puerto Rico to San Diego researching stocks and dredging up data on the weekly yields of their options.
I found my top 30 stocks to sell covered calls against and then recorded the options premium for a 1 week expiration (at a strike 2% above their current price), a 1 month expiration (at a strike 5% above their current price), a 2 month expiration (at a strike 8% above their current price) and finally a 3 month expiration (at a strike 15% above their current price) It’s a big spreadsheet.
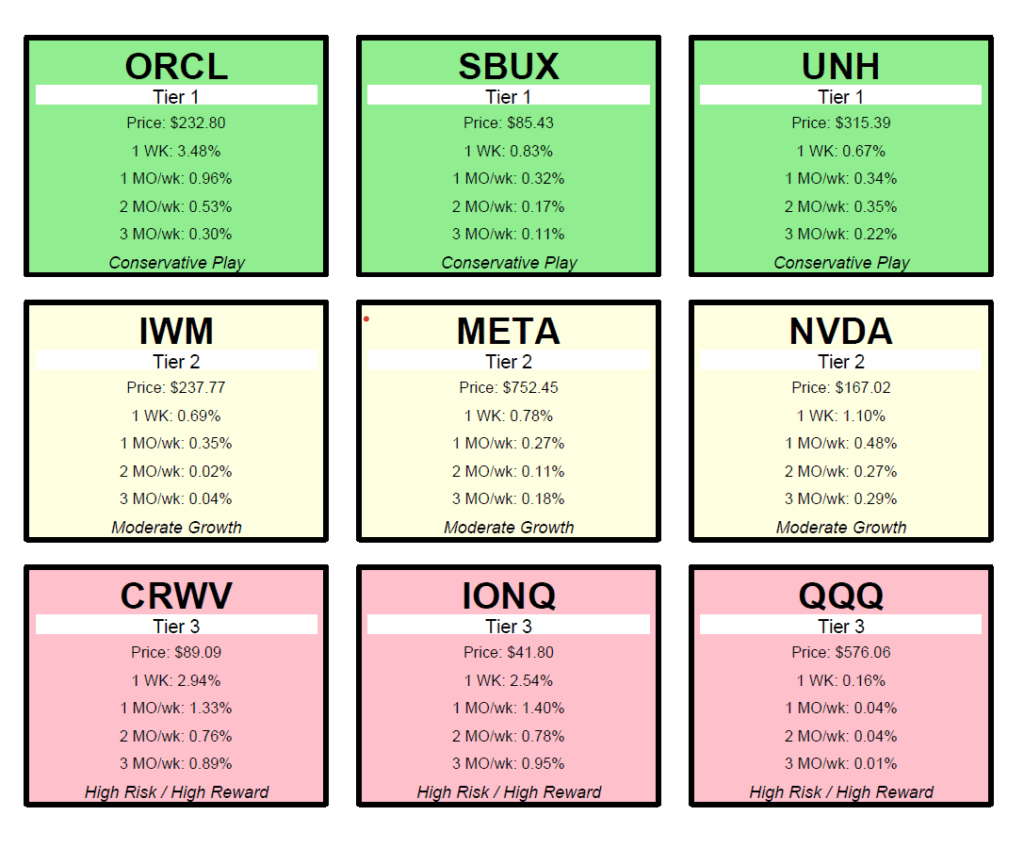
I then organized those stocks into 3 categories: Tier 1, Tier 2, Tier 3.
Tier 1: Stocks I would be ok owning ‘forever’. These will tend to be less volatile, meaning lower options premium. In fact you could even call some of them boring – think old school, blue chip stocks – AT & T, Johnson & Johnson, etc.
I may need to sell calls 1, 2, even 3 months out. They won’t generate the same amount of options premium, but they are reliable and for the most part, stress-free. Examples of stocks in this category that do still spit out decent returns include Oracle (ORCL), Starbucks (SBUX) and UnitedHealth (UNH).
Tier 2: Stocks I would be ok owning from 1 month to 1 year. These still generate some decent yields but also tend to be a bit more volatile and cause a bit more stress. Examples include index options like QQQ or IWM or more volatile tech stocks like Facebook (META) or Microsoft (MSFT).
Tier 3: Stocks and index funds I’m ok holding from 1 day to 1 month. Daily QQQ trades or highly volatile AI stocks like IONQ (IONQ) or Coreweave (CRWV) fall into this category. They generate an incredible yield but can literally rise or fall 20% in a week.
4. Weighted Average by Tier
At this point in the Spreadsheet you have calculated:
- Weekly Income Goal
- Working capital (the money you have to spend)
- Weekly Yield (the amount of options premium you expect to make each week).
Now we add in the last variable: weighted average by tier.
If you categorize the stocks you like by Tier (Conservative, Moderate, Aggressive) you will see that the weekly yield rises with the riskier the stock. So the final question is – how much risk do you want to take?
Put differently, how stressed do you want to be?
So the Spreadsheet contains a formula to calculate the weighted average you will need to achieve in order to hit your weekly income goals.
So what does it look like?
In the end this big, beautiful mess is a powerful tool. First, there is just the act of assembling it. Like I said, this took a good 8 hours of flight time to aggregate and organize the information before even layering in the formulae.
Second, it automatically updates the stock prices on a daily basis. I am sure there is a way to update the options premiums but I haven’t gotten there yet.
Next this opened my eyes wide to the various value – or lack of value – of certain stocks when it comes to options premium. People love Verizon – decent dividend, safe & reliable stock. Also, incredibly boring as a covered call stock. Oracle on the other hand? Huge returns on options (note Oracle rose 30% today alone, maybe that has something to do with it).
Finally, this tool is especially helpful for creating weighted tiers. While over time my goal is to move away from the Tier 3 (high risk) category, I never want to get completely away from it. I just don’t want to spend any more time with over 60% of my account balance in it, where it currently sits.